Tips and Tricks to Automate Your Monthly Reporting with Power Automate and Power BI🚀
“With great power comes great automation.” – Probably not Spider-Man, but it should be!
Welcome, fellow data enthusiasts and reporting wizards! If you’ve ever found yourself drowning in spreadsheets on the last day of the month, dreaming of a magical solution to streamline your monthly reporting, you’re in the right place. Grab your favorite caffeinated beverage, because we're about to embark on a journey filled with Power Automate, Power BI, dad jokes, and enough pop culture references to make Tony Stark jealous.
Why Automate? Because Who Has Time for Manual Reporting?
Imagine if every month you had to manually compile data from different sources, format it, create charts, and then send it off like a digital pen pal. Yikes! It’s like trying to assemble the Avengers without a plan – chaotic and stressful.
Automation swoops in like Iron Man with his suit, saving the day by handling repetitive tasks so you can focus on what truly matters: analyzing data and making strategic decisions. Plus, let’s be honest, who doesn’t love a little extra free time to watch cat videos or, you know, be productive?
Meet Your New Best Friends: Power Automate & Power BI
Power Automate 🌀
Think of Power Automate as your personal Jarvis. It automates workflows between your favorite apps and services, syncing files, getting notifications, collecting data, and more. Whether it’s sending reminders, moving data, or triggering actions, Power Automate has your back.
Power BI 📊
Power BI, the Tony Stark of data visualization. It turns raw data into stunning, interactive dashboards and reports. With Power BI, your monthly reports will look so good, your boss might just mistake you for a data Picasso.
Tips and Tricks to Automate Your Monthly Reporting
Before you dive into the automation matrix, it’s crucial to outline what you need from your monthly reports. Consider this your mission briefing before the superhero showdown.
Define Your Reporting Requirements 🎯
Key Metrics
Identify the KPIs and metrics that matter most to your organization. Whether it’s sales figures, customer engagement, or the number of cups of coffee consumed (hey, every metric counts!), knowing what to track is essential.
Pro Tip: Focus on metrics that align with your business goals. It’s like choosing the right Avengers for the right mission—each metric has its unique superpower.
Data Sources
Determine where your data resides—be it databases, cloud services, or spreadsheets. Knowing your data’s hideout is like knowing where Loki is planning his next move.😂😂😂
Real-World Example: Imagine your data sources are the Infinity Stones. Each one holds immense power, and together, they can create something truly epic.
Report Format
Decide on the layout and visualizations that best represent your data. Do you prefer sleek bar charts, dynamic line graphs, or maybe a pie chart that’s as satisfying as the perfect pizza slice?
Dad Joke: Why did the graph go to therapy? It had too many issues with its axes! 📈😂
Tip: Engage with Stakeholders Early
Get cozy with your stakeholders from the get-go. Ensure all necessary metrics are included and that the report format meets their needs. This proactive approach is like having a GPS for your reporting journey—it helps you avoid those pesky detours and revisions later on.
Pop Culture Reference: Think of stakeholders as your Justice League. Each member brings something unique to the table, ensuring your report is a balanced powerhouse.
Step-by-Step Guide: Automate Your Monthly Reports
Ready to roll up your sleeves? Let’s dive into a step-by-step guide to automate your monthly reporting using Power Automate and Power BI.
Let assume you’re the type who diligently downloads data from your organization’s ERP, CRM, or whatever other software your company uses in an Excel File , you’re already halfway to becoming a reporting superhero. Your data is ready and waiting—like the Tesseract in Thor’s possession, just needing the right tools to unleash its power.
Real-World Example: Picture your downloaded data as the Infinity Stones. Each piece holds immense power, and together, they can create something truly epic—your comprehensive monthly report.
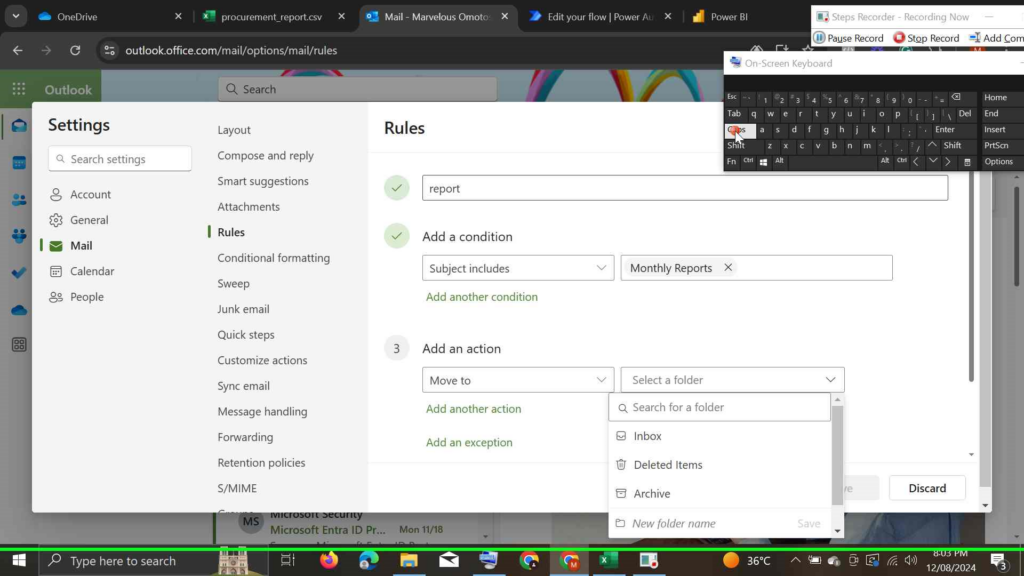
Step 1: Setup a rule in your outlook inbox
Log ino outlook with your office 365 email
Navigate to settings >> Click on Rules
Give your rule a name
Under Add a condition section, select Subject includes then type in a unique subject. Think of it as giving your rule a secret password to identify the right emails.😂😂😂😂
Under Add an action, select Move to, then you select a specified folder, or create a unique folder for this purpose. (See the screenshot below for a visual guide on setting up your rule.)
To simply explain what we did here in plain english (or plain superhero lingo), we just set a rule in our Outlook inbox that says:
“Whenever an email arrives with a subject that includes [Your Unique Subject], move it to the [Your Specified Folder].” It’s like having Alfred the Butler manage your daily mail—efficient, reliable, and always on point.😂😂😂
Pro Tip: Test your rule by sending a sample email with the unique subject to ensure it’s working like a charm. No one wants their important emails floating around like lost Avengers in New York City. 🗽🦸♀️
Step 2: Setup a Power Automate Flow
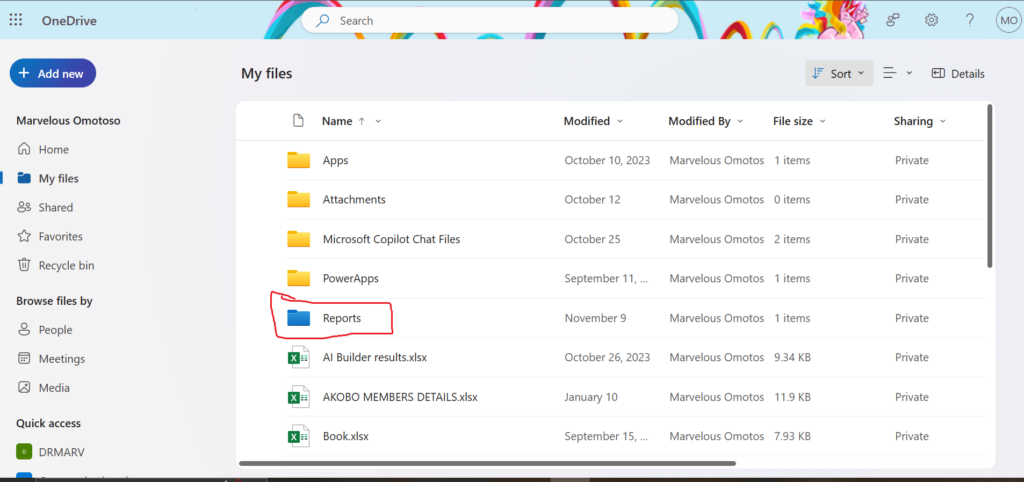
NOTE: Before you begin developing a flow, make sure you've created a seperate folder with a unique name you will always remeber in your OneDrive Business. [e.g. lets name our folder Reports]
Log into make.powerautomate.com with your credentials
Navigate to templates, there are lots of prebuilt templates you can leverage on
Select Save Office 365 email attachments to specified OneDrive for Business folder
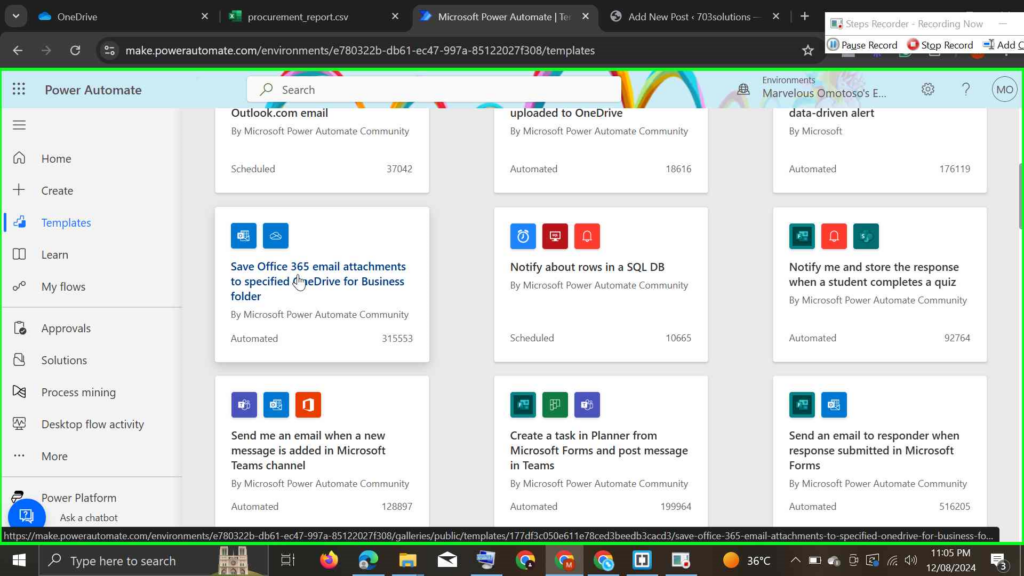
You will be prompted to create a connection to your office 365 outlook and Onedrive for Business
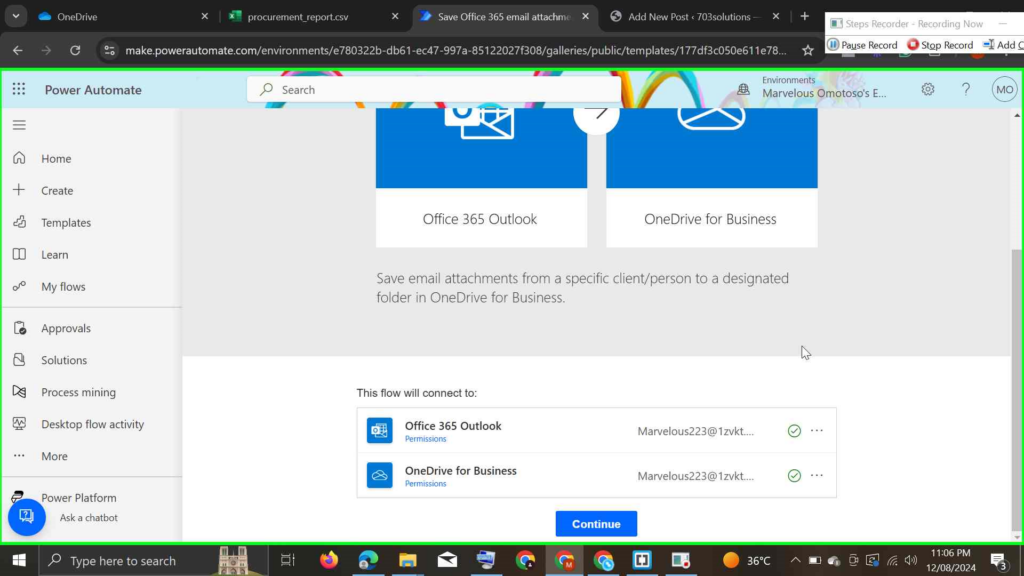
Click continue to configure the flow, you will be directed to the flow designers page
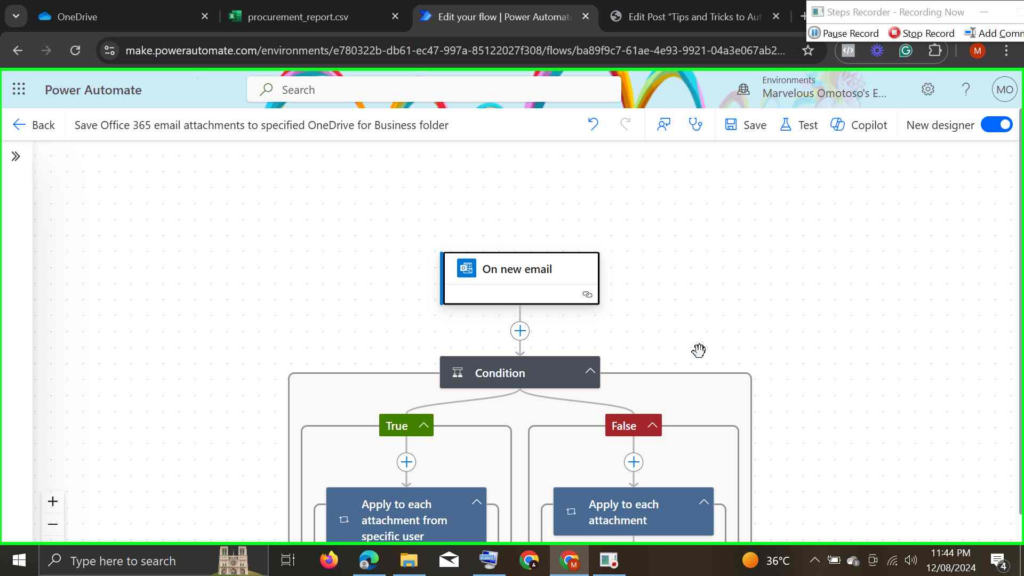
Click On new email which is the Trigger, see screenshot below to set the parameters accordingly, in the folder section, instead of inbox, change it to the folder you created when you were setting up rules in your outlook inbox.
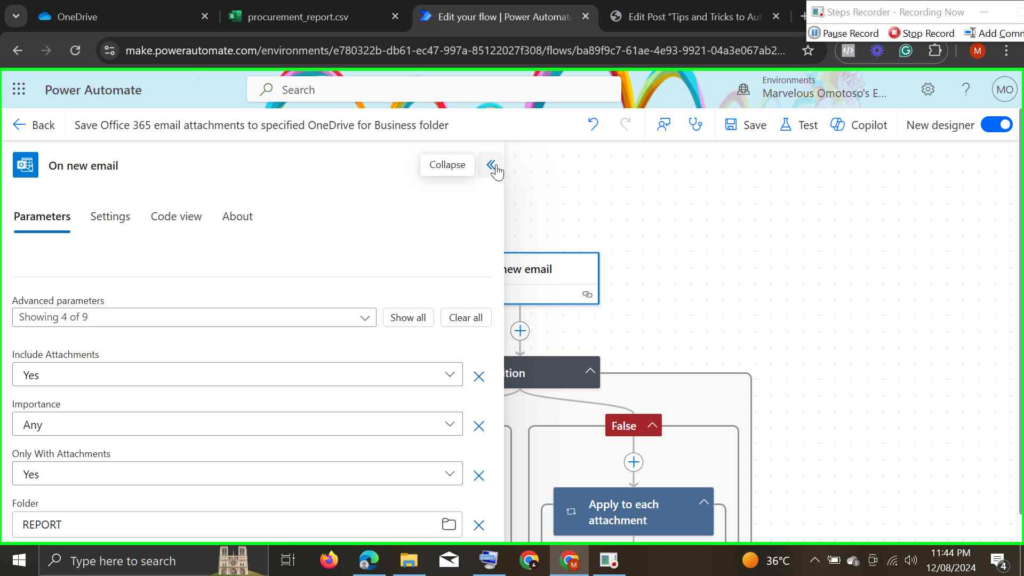
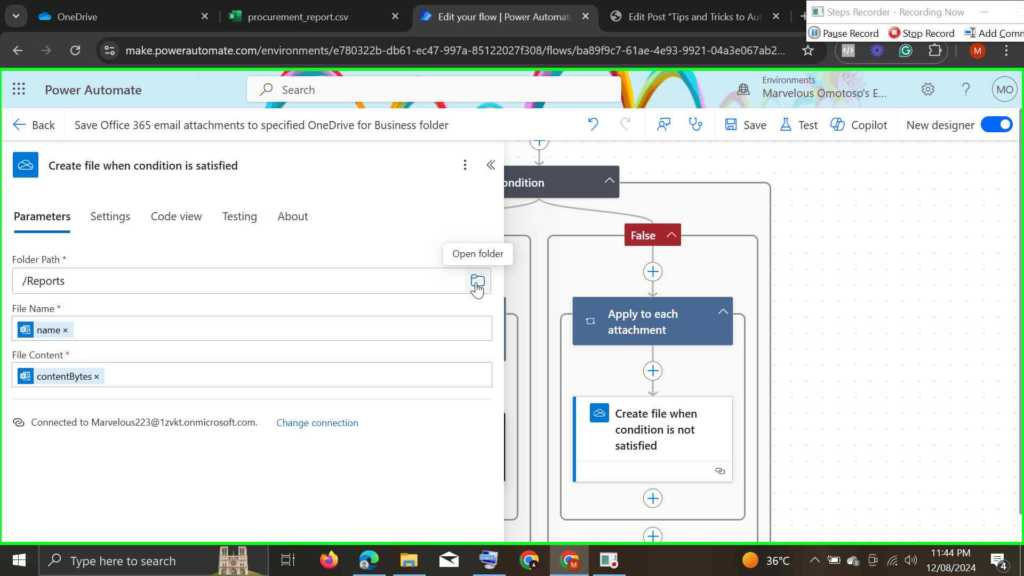
Click on Create file when condition is satisfied, which is the action the flow will take once it triggers
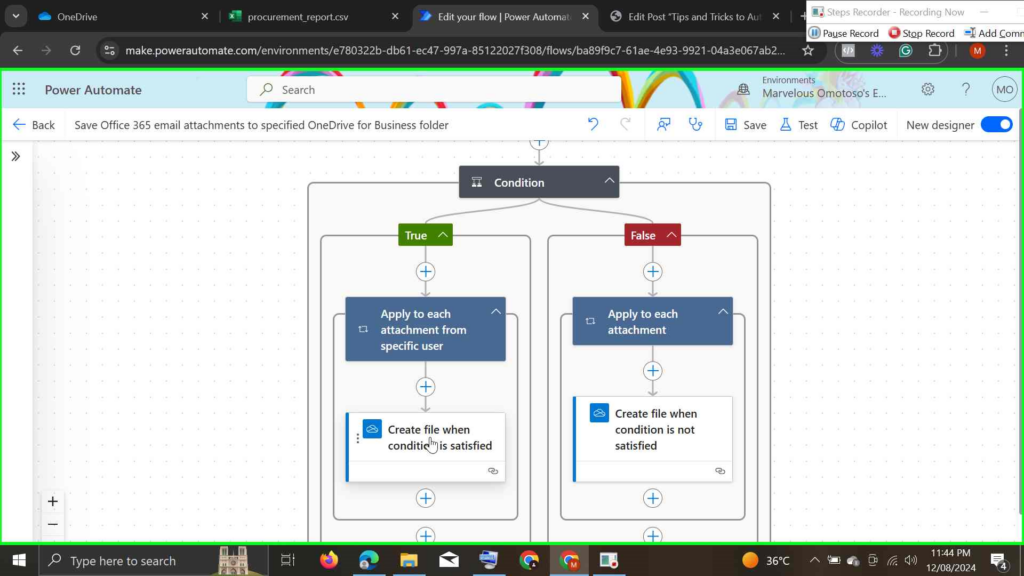
see screenshot below to set the parameters accordingly, in the folder path section, instead of root, change it to the folder you created in your OneDrive Business.


Leave the other settings the way it is, save and test your flow by sending the downloaded excel data to the email you set up a rule for in step 1, make sure you use the unique subject you set in step 1 as your subject when sending the mail, you will notice the file is automatically saved into the folder you specified in your OneDrive Business.
Step 3: Setting up a Power Bi Dashbaord for your report
Note: Remember we are using an excel file you downloaded from your company's ERP, CRM, or whatever other software your company uses. Your excel file must be in .csv (comma-separated values) extension.
Now it’s time to channel your inner Tony Stark and send your meticulously organized data to Power BI. Why? Because we’re about to create visualizations that spotlight the KPIs and metrics that truly matter to your organization. Think of it as giving your data the Avengers treatment—each metric playing its part to save the day. 🦸♂️🦸♀️
But hold your horses (or should I say, hold your Hulk smash)! I’m not going to dive deep into the intricate art of designing an interactive dashboard. Nope, this blog post is all about the tips and tricks you need to automate your monthly reporting like a pro.
Log into your OneDrive Business and locate the folder you created for the flow to save the attachments, click on the file for it to open with Microsoft Excel Online.
Click on the dropdown menu labelled viewing at the top right corner

The file will be opened with Microsoft Excel App on your PC
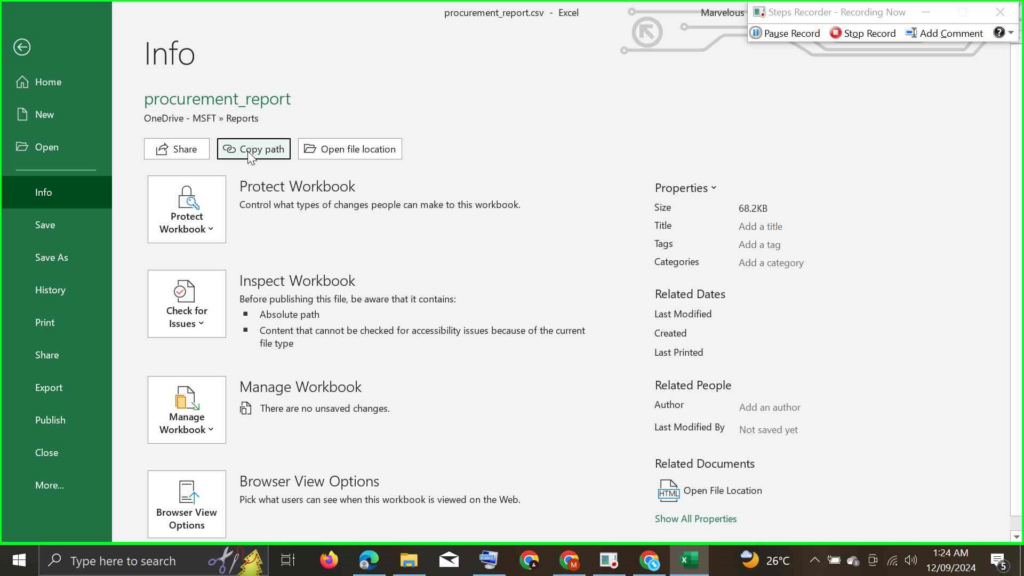
Once the file is opened with your desktop app, click on File at the top left corner, next click on info >>> copy path
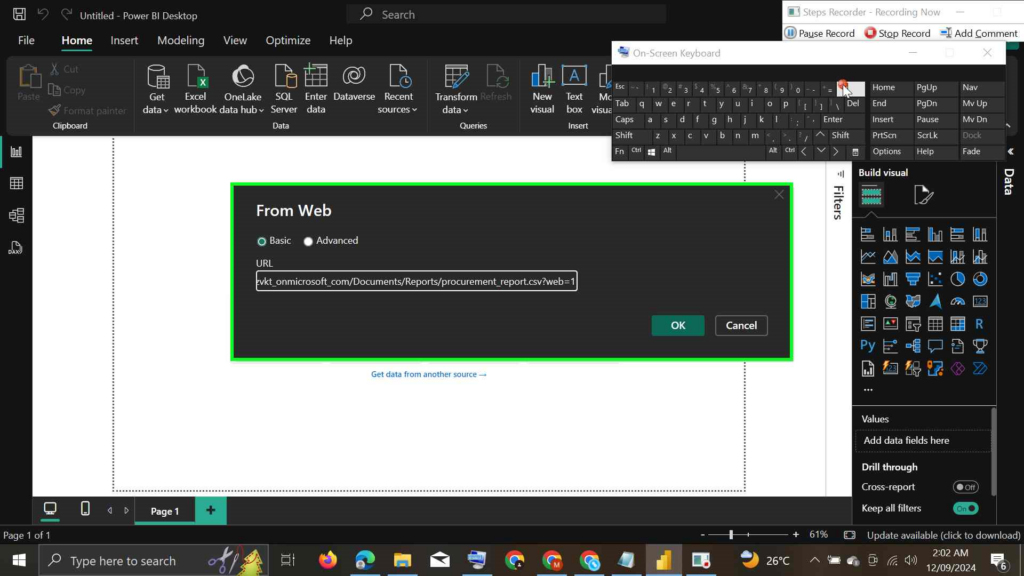
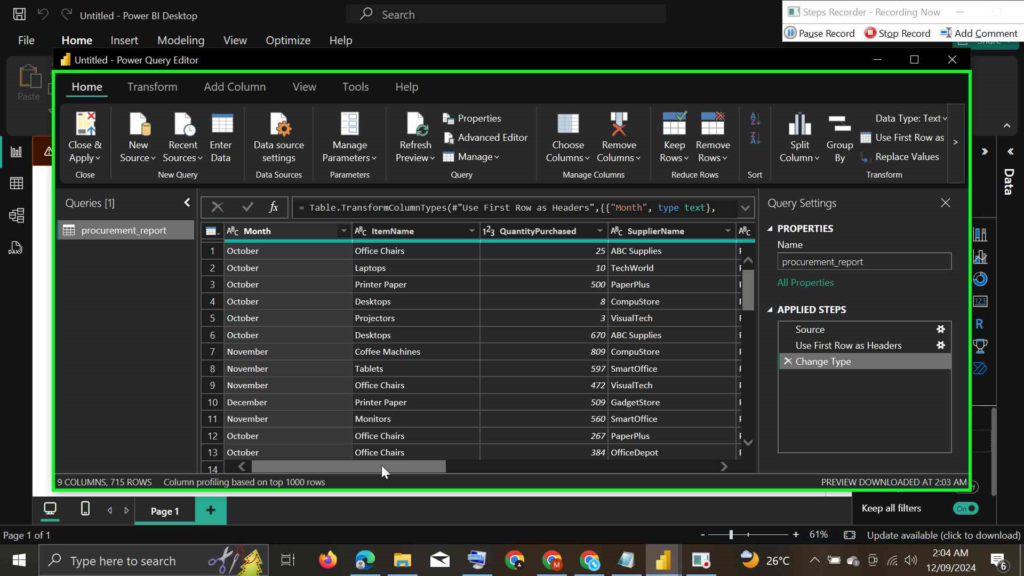
Now log ino your power bi desktop to load the data into power bi, click Get data, you will be presented with a list of data sources to pick from, search web and select web as your data source.
Remember the path you copied from the Excel Desktop App, paste it in the url box and note the ?web=1 after .csv, kindly delete from 1 to ? , your url should end with .csv not =1 >>> click ok once you are done deleting the unwanted parameters from the url
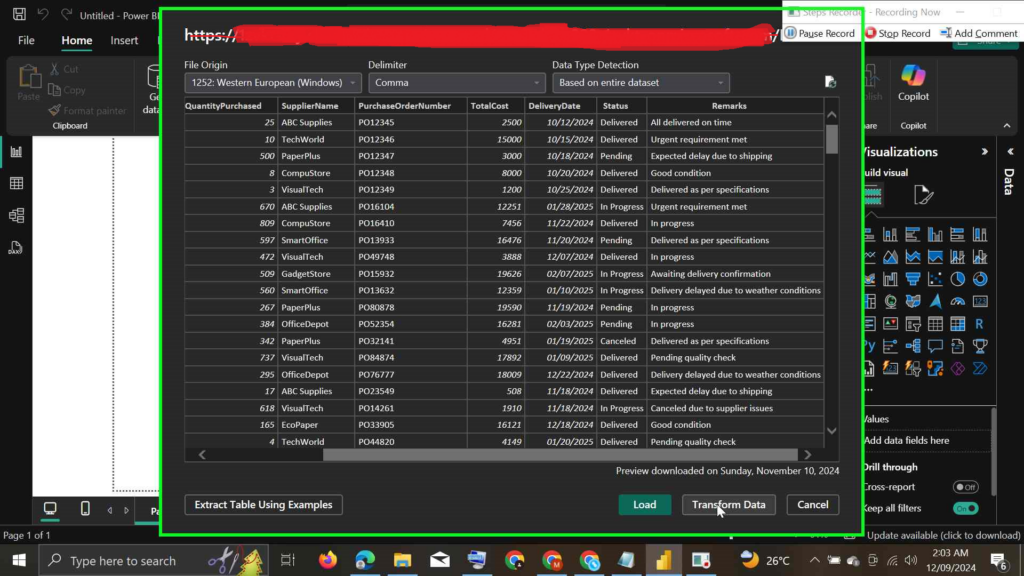
Once you click ok, your data will loaded to power bi. You can choose to load or transform your data using the built in power query editor.
Once you are done building your visuals, save and publish your report to your power bi workspace
Step 3: Setting up a scheduled refresh for your report
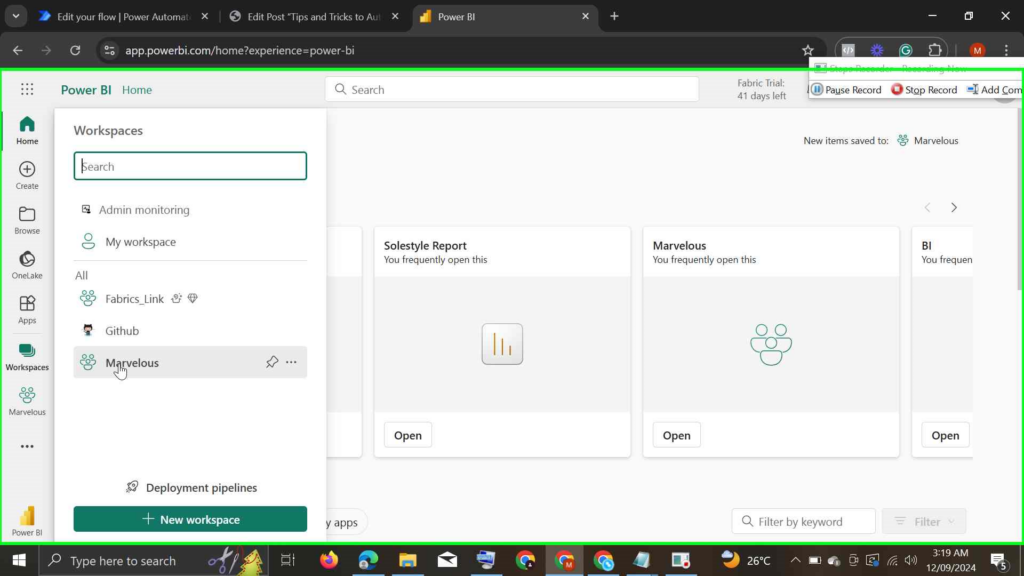
log into Power Bi Services with your credentials
Navigate to the workspace you published your report to
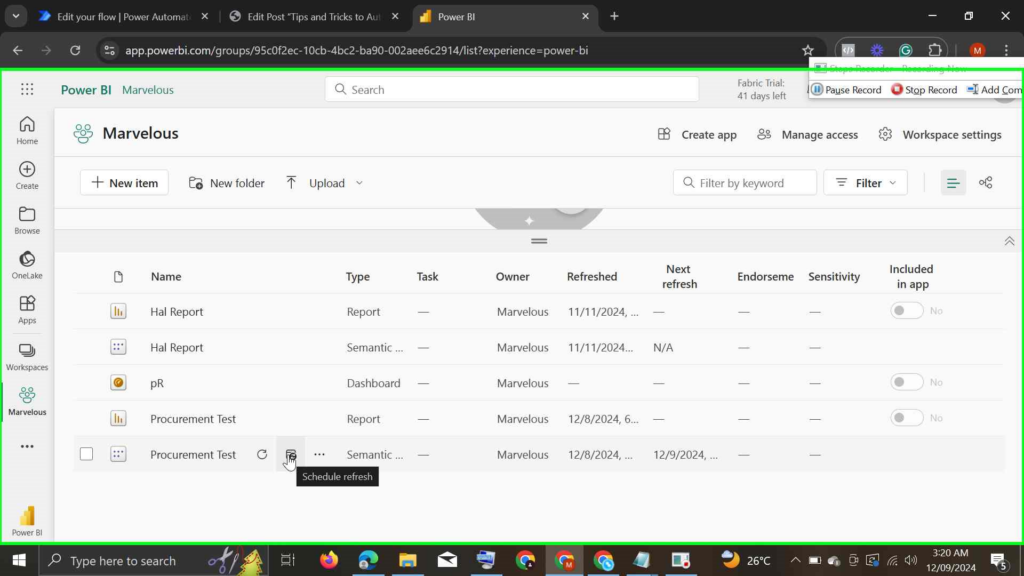
Locate the report you published to your workspace, you will notice their are two files, one is labelled as report and the second semantic. Click on schedule refresh (See the screenshot below for a visual guide )
After you've clicked schedule refresh, select Gateway and cloud connections to create a connection to the semantic model
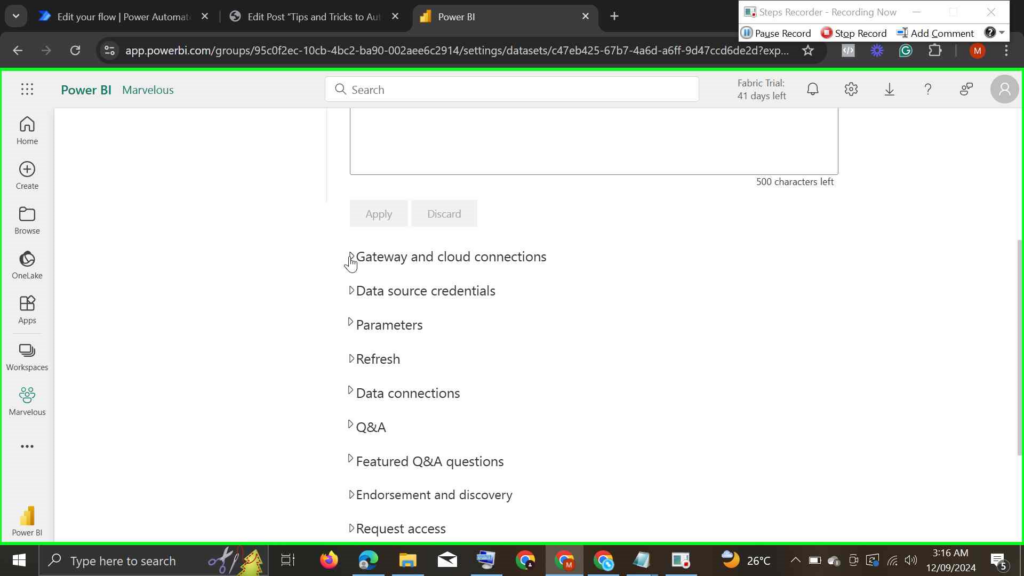
I already created a connection to this semantic model, but let's create a new connection.
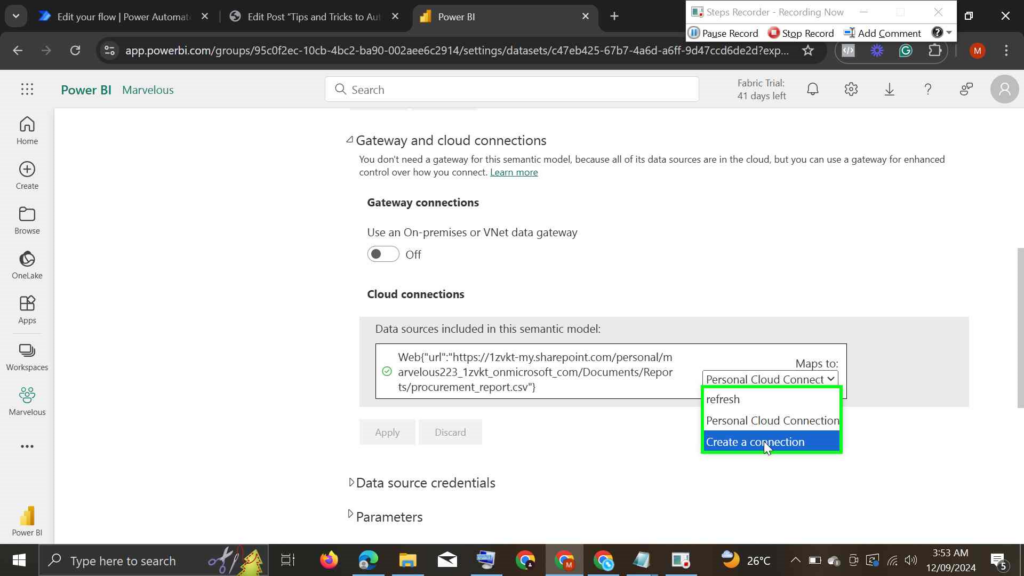
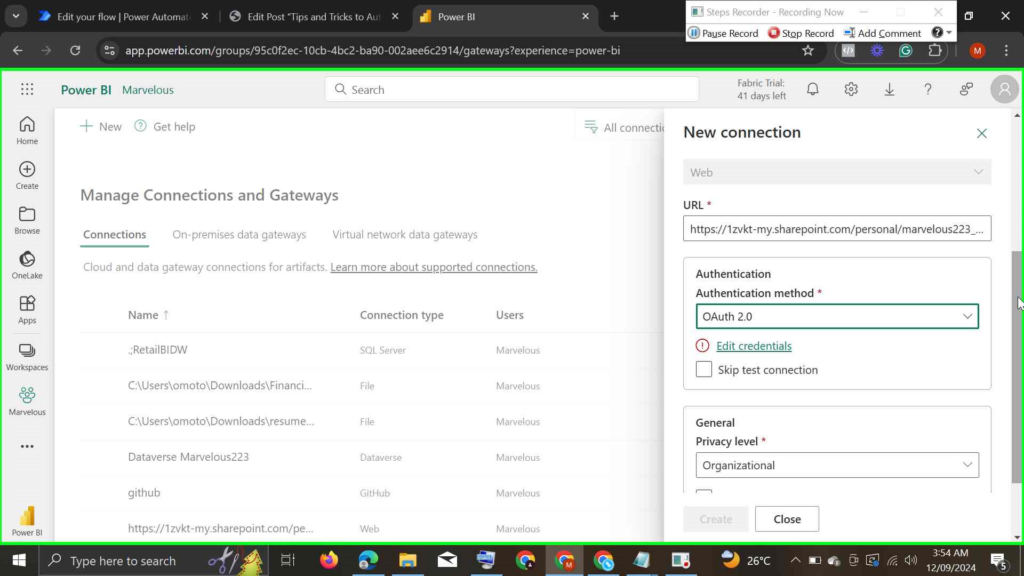
Name your connection, don't tamper with the url, scroll down to Authentication method and select OAuth 2.0, then scroll down to edit credentials, you will be prompted to authenticate with your credentials. Make sure you authenticate with the credentials associated with your onedrive business. And be sure to select any privacy level of your choice. Once you are done click on create
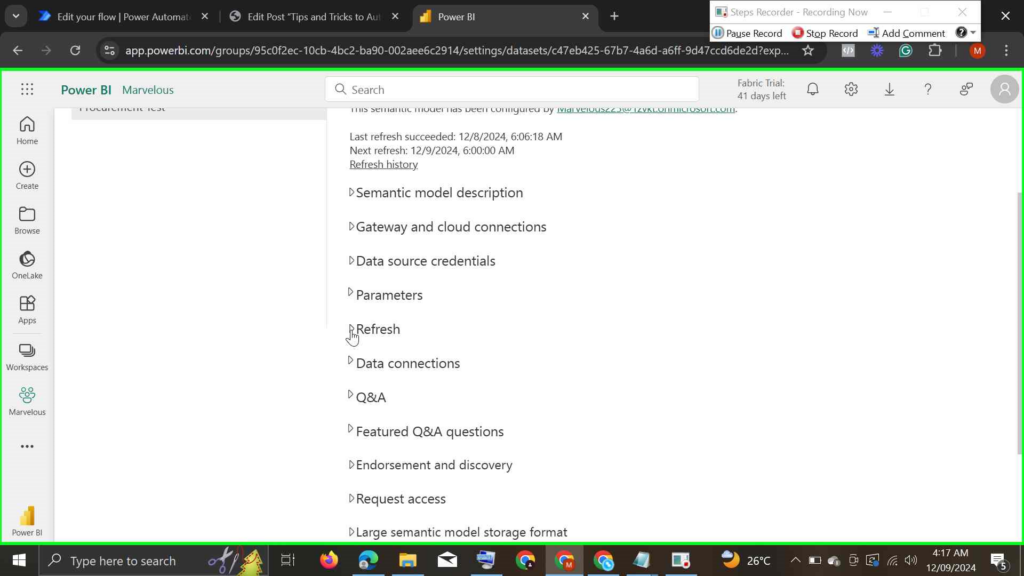
Now that you've successfully create a connection, lets schedule the refresh >>> click Refresh
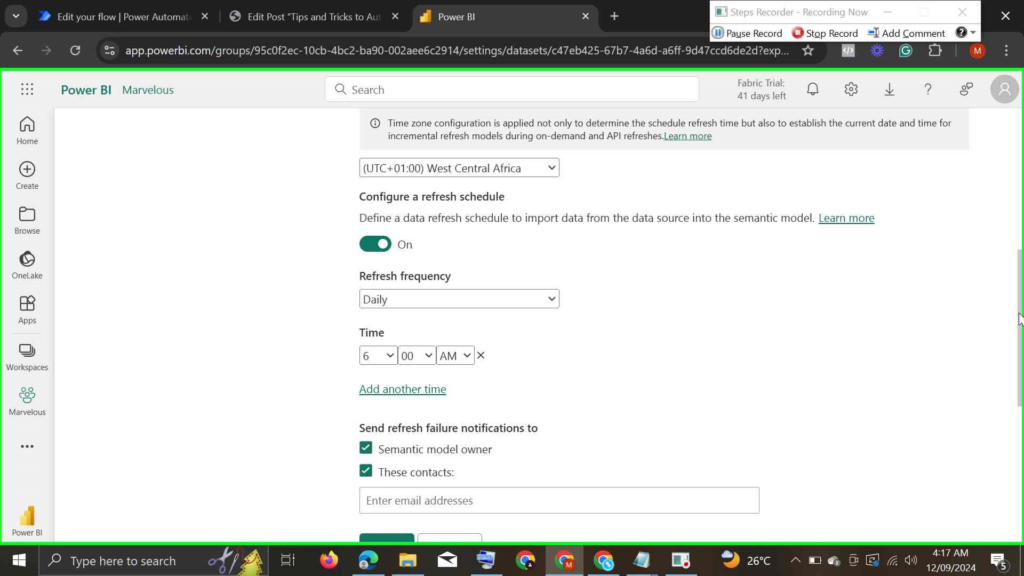
Once you've clicked refresh, you will be prompted with the option to select your time zone, refresh frequency and time. You also have the opporunity to enter a preferred email address incase there is a refresh failure, you will be noified via the email address. Once you are done filling in necessary details, click apply.
To provide a clear overview from beginning to end, let’s break down how the magic unfolds once you’ve got your data ready. Picture this: you’ve heroically downloaded your data into an Excel file (cue the triumphant superhero theme 🎶), and now it’s time to send it off on its automated adventure. All you need to do is send the Excel file as an attachment to the email you set up a rule for in Step 1. Think of it as dispatching your very own data Avengers team—each piece of information ready to save the day without you having to lift a finger. 🦸♂️🦸♀️. Now, take a deep breath and relax. While you focus on more important things—like finally finishing that series on Netflix or perfecting your barista skills—Power Automate and Power BI are busy handling the heavy lifting. Your only responsibilities? Downloading the data and sending it as an attachment. Easy peasy, lemon squeezy! 🍋✉️. When it’s time for Power BI to refresh, it automatically retrieves the new data you sent to your email from OneDrive for Business. Imagine Power BI as your very own Jarvis, seamlessly updating your dashboard with the metrics and KPIs you established on day one. It’s like having a personal assistant who never sleeps, ensuring your dashboards are always up-to-date without you having to lift a finger.
This streamlined process saves you tons of hours that you would otherwise spend rebuilding your visualizations from scratch. More time for you to be the superhero you were meant to be—whether that’s saving the day at work, perfecting your latte art, or finally getting around to that hobby you’ve been putting off.
Conclusion: Embrace the Automation Force
Congratulations, you’re now equipped with the tips and tricks to automate your monthly reporting using Power Automate and Power BI! By embracing automation, you’re not just saving time – you’re elevating your reporting game to superhero status. 🦸♂️🦸♀️ Remember, automation is all about working smarter, not harder. With Power Automate handling the repetitive tasks and Power BI transforming your data into insightful dashboards, you can focus on what truly matters: making data-driven decisions that propel your organization forward.
So, put on your cape, harness the power of automation, and let your reports soar higher than Iron Man’s flight. And hey, if you ever feel stuck, just remember: even the Avengers had a team to back them up. Happy automating!
“Automation is going to cause unemployment, but it’s also going to be creating new opportunities.” – Just kidding.😂😂😂, it’s all about enhancing your productivity and unleashing your inner data superhero!
Questions?
If you have any questions or feedback about Tips and Tricks to Automate Your Monthly Reporting with Power Automate and Power BI, please leave a message in the comments section below. You can post using your email address and are not required to create an account to join the discussion.